Insights
The Insights page is the single optimization surface in CLARITY. Every finding the engine produces — idle resources, underutilized capacity, oversized instances, missing tags, lifecycle gaps, security hardening opportunities — lands here with a unified lifecycle workflow.
Right-sizing recommendations are no longer a separate page. When the engine detects a resource that should be downsized, terminated, or up-sized for performance, the matching insight card carries an inline action block with the current → recommended instance type, projected cost, effort badge, and an Apply button that creates a baseline snapshot for verified savings tracking. See Action block below.
The standalone Commitments page is the buy-side complement — Reserved Instances, Savings Plans, and Committed Use Discounts.
Single unified feed
Findings from every rule in the engine — idle resources, underutilized capacity, oversized instances, missing tags, commitment opportunities, lifecycle gaps, and more — appear in one feed grouped by category. No more separate "System Findings" and "Underutilized Resources" sections to reconcile.
Each card carries:
- Severity badge —
critical/high/medium/low - Status pill — what kind of optimization this is (see below)
- Service / region / instance type — context badges
- Age — days since the finding was first detected (escalates colour after 7d / 30d to surface stale unresolved items)
- Cost-center pill — which business owner the finding rolls up to (when business mapping is configured)
- AI validation pill —
Agree/Disagree/Partial(when AI analysis is enabled) - Estimated monthly savings — if applicable
Status pills
The status pill names the kind of optimization at a glance, regardless of which provider rule produced the finding:
| Status | Meaning |
|---|---|
| Idle | Provisioned but unused — typically <5% utilization or zero traffic |
| Underutilized | In use but well below provisioned capacity — typically 5-30% utilization |
| Oversized | Capacity exceeds workload requirements — right-size to a smaller tier |
| Untagged | Resource lacks tags needed for chargeback and ownership attribution |
| RI/SP/CUD opportunity | Sustained usage suggests a Reserved Instance, Savings Plan, or Committed Use Discount would lower the bill |
| Lifecycle policy | Storage object retention/transition rule missing — old data accumulating at hot-tier price |
| Security hardening | Security control missing (WAF, public access, etc.) that may also drive cost |
| Data transfer | Inter-region or egress traffic is a meaningful share of the bill |
| Network | Networking resource (NAT, VPC endpoint, IP) configuration suggests savings |
| Anomaly | Recurring cost-pattern deviation from baseline |
| API cost | Provider-side metered API usage (CE pagination, BigQuery scans) |
Filter chips
A row of multi-select filter chips above the feed lets you narrow what you see without losing the totals:
- Status — pick one or more statuses (Idle, Untagged, etc.)
- Severity —
critical/high/medium/low - Category — Compute / Database / Storage / Networking / Containers / Machine Learning / Analytics / Web / Governance / Commitments / Monitoring / Other
Each chip shows the unfiltered count (e.g. Idle (6), Critical (5)) so you can see what each filter would surface before clicking. Chips that have zero findings on the current account are hidden — no clutter for filters with nothing to do. Filters AND across dimensions, so picking Status: Idle + Severity: Critical + Category: Database lands you on idle critical database findings only. A Clear filters link appears whenever any chip is active.
Minimum Cost Threshold
Only resources costing more than $10/month are flagged. Low-cost resources are excluded to keep the signal-to-noise ratio high.
Tag coverage gate
A tag-coverage warning sits at the top of the page when your account is below the 80% coverage threshold. Untagged resources distort every savings number on the page — chargeback rolls them into "Shared Infrastructure" instead of their real owner, and right-sizing recommendations can't be attributed to a team.
The warning shows the gap (e.g. 73.0% on demo-aws-587432109876 — chargeback accuracy will be reduced), how much spend it represents (12% of spend untagged), and links to the Tag Health tab for remediation. Dismissing it collapses to a small "tag warning hidden — click to show" pill at the top of the page; click the pill to bring back the full panel.
Provider-Specific insights
Each cloud provider has unique optimization opportunities:
AWS
- NAT Gateway optimization — Identify expensive NAT traffic that could use VPC endpoints
- ECR lifecycle policies — Flag repositories without image cleanup rules
- EBS volume optimization — Detect unattached or underutilized volumes
- ECS/Fargate right-sizing — Analyze container CPU and memory reservations
Azure
- Stopped VM billing — Deallocated VMs that still incur disk charges
- Unattached managed disks — Orphaned disks with no associated VM
- App Service plan consolidation — Underutilized plans that could be merged
GCP
- HA in development — High-availability configurations on non-production workloads
- Persistent disk snapshots — Old snapshots consuming storage unnecessarily
- Idle Cloud SQL instances — Databases with minimal query activity
Cross-provider
- Inter-AZ excess — Fires when account-level inter-AZ data transfer (zone-to-zone in the same region) crosses $300/mo. Names the top byte-emitting resources from CloudWatch / Azure Monitor / Cloud Monitoring per-NIC counters and recommends same-AZ co-location, topology-aware load balancing, and same-AZ caching. Conservative 40 % savings estimate assumes only a fraction of inter-AZ chatter is structurally reducible. See the Inter-AZ data transfer attribution panel on the Dashboard for the account-level view.
Action block (current → recommended)
When the right-sizing engine detects a matching resource on the same resourceArn as an insight, the card expands with an inline action block:
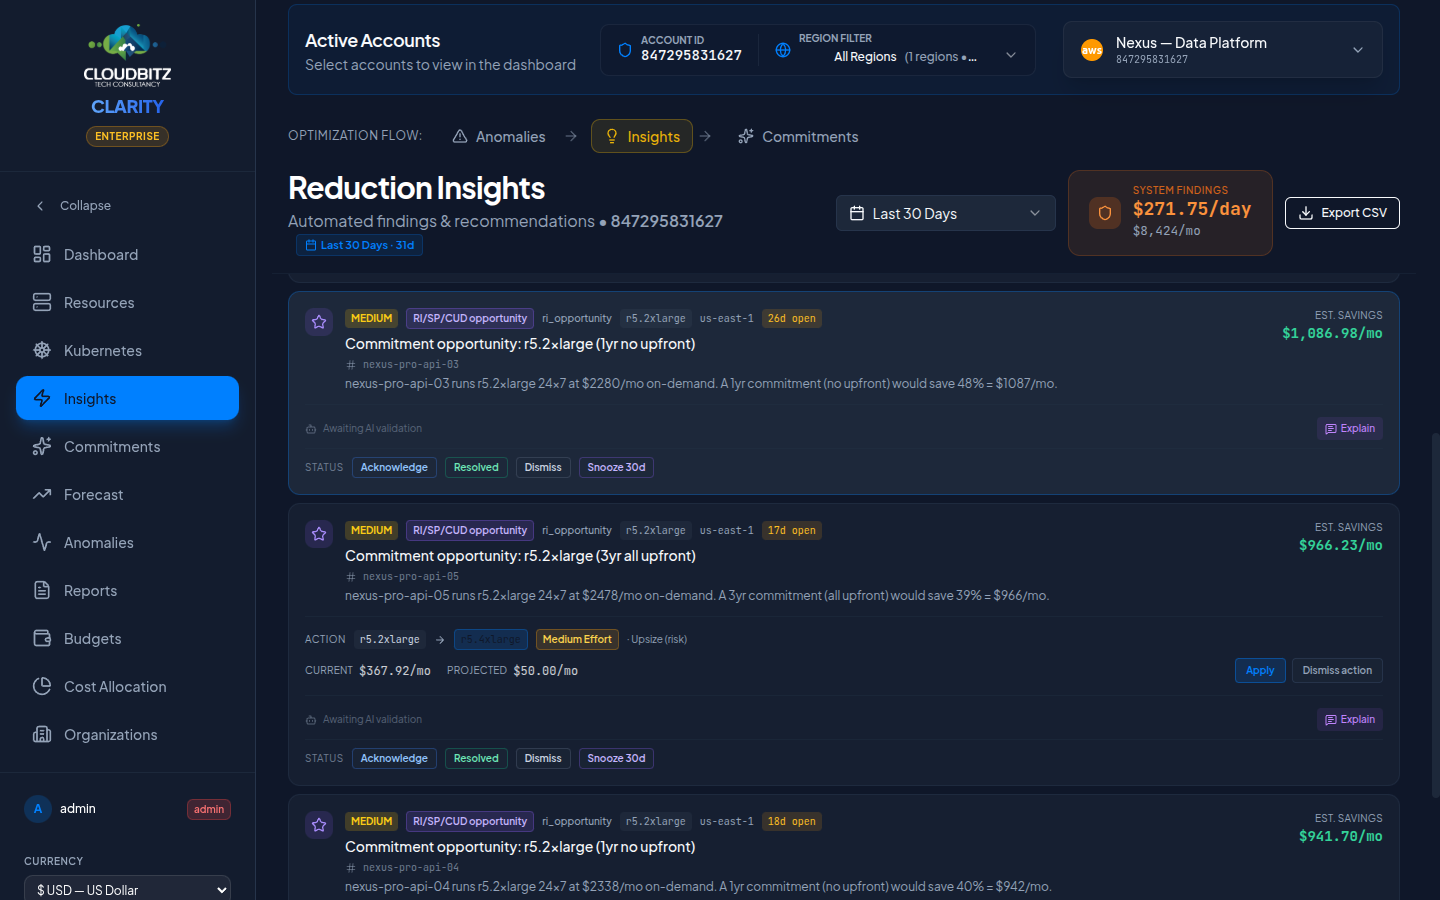
The block surfaces:
| Element | What it tells you |
|---|---|
| Current → Recommended instance type | Direct swap, side-by-side, in monospace so the family/size delta is obvious |
| Effort Impact badge | Easy Win / Medium Effort / High Effort — same classification the legacy Recommendations page used |
| Direction label | Downsize (saves money) / Upsize (risk) (mitigates performance risk, costs more) / Terminate / Optimize |
| Current / Projected / Savings | Three honest dollar figures. For upsize-risk findings, projected exceeds current and there is no savings figure — the card is about risk, not cost reduction |
Apply button
Clicking Apply posts to the savings ledger:
- CLARITY creates a baseline cost snapshot for the resource (current daily and monthly costs).
- You make the change in your cloud provider's console.
- Over the next 7+ days, the verification job compares actual costs to the snapshot. Once the delta stabilises, the savings move from
partialtoverifiedconfidence on the ROI Report.
The button is honest about what it does — it does not make the change in your cloud account. CLARITY never has write credentials. It records that you committed to acting so the system can measure whether you actually realised the savings.
A Dismiss action button next to Apply records that you reviewed the recommendation and chose not to act. The insight itself stays in its lifecycle (Open / Acknowledged / Resolved / Dismissed) — dismissing the action and dismissing the insight are two different decisions.
Right-sizing and lifecycle are independent
Marking a finding as Resolved in the lifecycle doesn't auto-Apply the action — and clicking Apply doesn't auto-Resolve the finding. The lifecycle tracks your review status; the Apply ledger tracks committed actions. Both flows feed the same hash-keyed identity so decisions survive sync regenerations.
Recommendation categories
The action block surfaces three broad recommendation categories:
Right-Sizing
Suggests a smaller (or larger) instance type based on observed CPU, memory, and network utilization. Drives most of the Apply-eligible cards on the page.
Resource cleanup
Identifies resources that can be safely deleted:
- Unattached storage volumes
- Old snapshots beyond retention policy
- Unused Elastic IPs or static addresses
- Idle load balancers with no targets
Cleanup recommendations show Terminate as the direction; the projected cost is $0 and the savings equal the current cost.
Commitment purchase
Reserved Instances, Savings Plans, and Committed Use Discounts live on their own Commitments page (a "buy" decision is structurally different from a per-resource action).
Effort classification
Each recommendation includes an effort estimate:
| Effort | Description | Examples |
|---|---|---|
| Low | Can be done in minutes, minimal risk | Delete unattached disk, remove old snapshot |
| Medium | Requires testing or a maintenance window | Right-size a VM, modify an instance type |
| High | Involves architecture changes or migration | Move to Spot instances, consolidate services |
Savings estimation
Every recommendation includes an estimated monthly savings figure. Savings are calculated using:
- Current resource cost (from billing data or pricing catalog)
- Recommended resource cost (from the provider's pricing)
- The difference, projected to a monthly figure
WARNING
Savings estimates are projections based on current usage patterns. Actual savings may vary if workload characteristics change after implementation.
AI validation
When AI analysis is enabled, each insight is validated by an AI model that reviews the underlying data and context. Validation results appear as badges:
| Badge | Meaning |
|---|---|
| Agree | AI confirms the recommendation is sound |
| Disagree | AI found reasons the recommendation may not apply |
| Partial | AI agrees with the finding but suggests a different action |
Explain button
Click the Explain button on any insight to get an AI-generated explanation that covers:
- Why this resource was flagged
- What the usage data shows
- Whether the recommendation is safe to implement
- Any risks or caveats to consider
TIP
AI explanations are cached for 24 hours. Subsequent clicks return the cached explanation instantly.