Dashboard
The Dashboard is your central command center for cloud cost visibility. It provides a real-time overview of your multi-cloud spend across AWS, Azure, and GCP in a single pane of glass.
At a glance
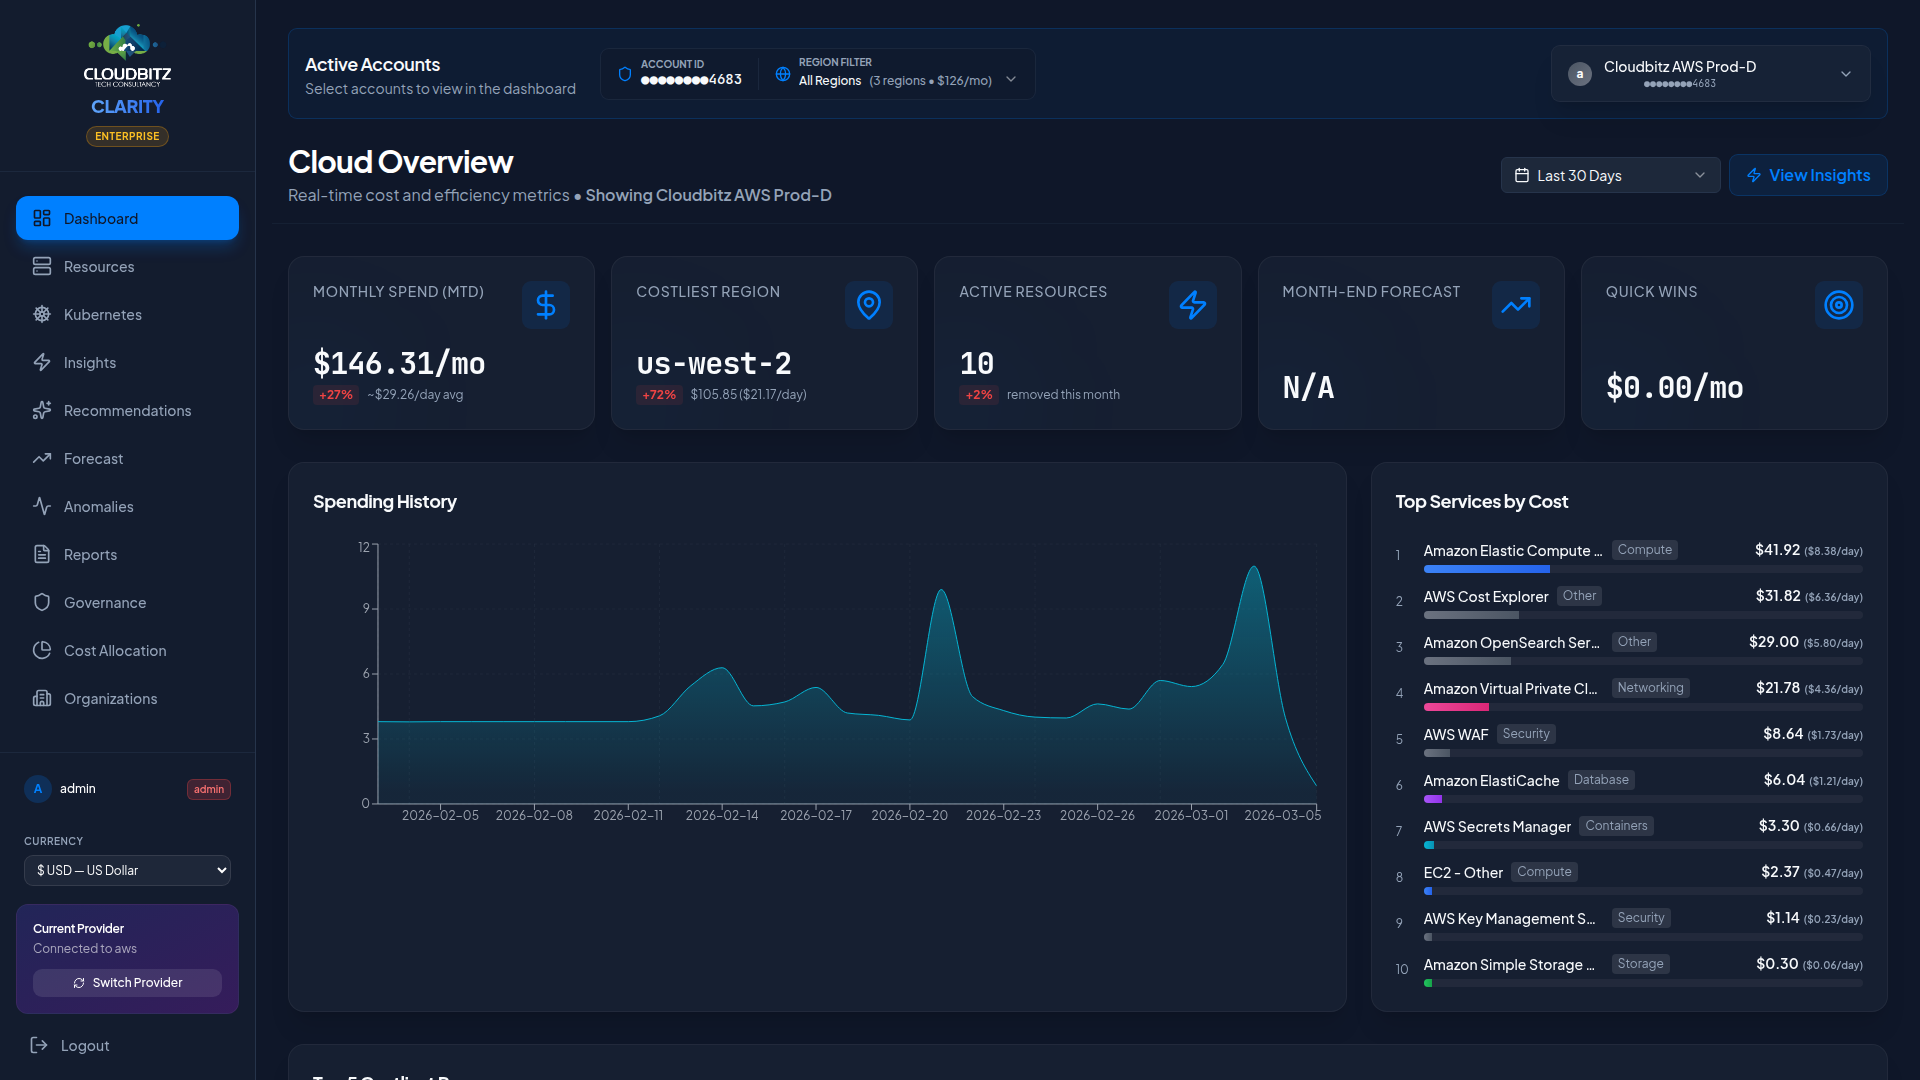
When you first log in, the Dashboard surfaces the metrics that matter most:
| Metric | Description |
|---|---|
| Total Spend (MTD) | Month-to-date spend across all connected cloud accounts |
| Month-over-Month Change | Percentage change compared to the previous month |
| Daily Cost Trend | Interactive chart showing daily spend over the selected period |
| Provider Breakdown | Pie chart splitting costs by cloud provider |
| Top Services | Ranked list of your highest-cost services |
| Quick Wins | Actionable savings opportunities you can act on today |
| Budget Status | Progress bars for active budgets with threshold alerts |
| Tag coverage | Hero card showing % of resources tagged, with severity tier and worst-3 services |
| Data freshness badge | Shows the latest finalised UTC day in the data and how recently we synced |
Tag coverage hero card
A dedicated card surfaces tag-coverage health up front because it's the cheapest accuracy lever in the platform — bad tagging accounts for the majority of attribution error in real customer accounts. The card shows:
- Headline % and severity tier —
Healthy(≥80%),Needs attention(50-80%),Critical(<50%) with matching colours. - Cost-weighted view — alongside the count-weighted percentage, the card shows the % of spend that's tagged. These can diverge dramatically: 19 small tagged resources vs 1 large untagged resource is 95% by count but 1.9% by spend.
- Lowest coverage by service — three small tiles surfacing the categories with the worst coverage (e.g.
Storage 45%,Containers 69%,Serverless 80%). - Account scope — when you've selected an account, the card scopes to that account and the headline reads
... on <account-name>. With no account selected the card shows... across all accounts. - Review tags → button deep-links to the Tag Health tab in Cost Allocation.
When coverage is healthy and you've seen the card, you can dismiss it for a week. Below threshold the card stays visible and escalates to amber/red — the data is too important to hide.
Data freshness badge
Cloud-provider billing APIs settle a UTC day 24-48 hours after it ends. The freshness badge in the dashboard header makes this honest:
Settled through <date>— the latest UTC day for which data is finalised (yesterday in normal operation).synced <ago>— how long ago our pipeline last pulled from the provider.- A hover tooltip explains today's row exists but is still updating.
This means the daily-average figure on the dashboard is computed only from completed days; it doesn't dilute by today's still-settling partial. Customers can reconcile our numbers against AWS Cost Explorer / Azure Cost Management / GCP BigQuery export and see they agree.
Date range selector
Use the date range selector in the top-right corner to control the time window for all dashboard widgets.
| Option | Description |
|---|---|
| Last 7 Days | Recent week of spend data |
| Last 30 Days | Rolling month view |
| Last 90 Days | Quarter-level trend analysis |
| Custom Range | Pick any start and end date |
Smart Default
Early in the month (days 1-6), CLARITY automatically defaults to Last 30 Days instead of the current month. This prevents misleading comparisons when only a few days of data are available.
Provider filter
If you have multiple cloud providers connected, use the provider filter to focus on a single provider or view all providers combined.
- All Providers — Aggregated view across AWS, Azure, and GCP
- Single Provider — Filter to see only one provider's costs, services, and trends
The selected provider persists across all pages during your session, so switching on the Dashboard applies everywhere.
Cost breakdown views
The Dashboard offers three ways to slice your cloud spend:
By service
See which cloud services (EC2, Azure VMs, Cloud Storage, etc.) are driving the most cost. The top services panel ranks them by total spend and shows the trend direction.
CLARITY automatically decomposes the bundled buckets that hide the most spend on a typical bill — EC2 - Other, S3 - Other, AWS Data Transfer, Azure Bandwidth / Storage / Networking, and GCP service rollups. Instead of one opaque "EC2 - Other: $48,200" row, you see the actual cost drivers:
- EC2 / NAT Data Processing
- EC2 / EBS Volumes (gp3)
- EC2 / EBS Snapshots
- EC2 / Inter-AZ Data Transfer
- EC2 / Public IPv4 (attached)
- S3 / Requests (PUT/POST/LIST Standard)
- Bandwidth / Inter-Region Egress
- Compute Engine / Instance vCPU
- Compute Engine / Persistent Disk
The decomposition runs against the same live billing APIs as the rest of the Dashboard (Cost Explorer, Cost Management, BigQuery export) — no Cost & Usage Report ingestion, no S3 export to configure, no 24-48 hour wait for a file to arrive. Sub-services refresh on the same schedule as everything else.
Drill-down
Sub-services group under their parent service for a clean top-level view. Click a parent service header to expand it inline and see the cost breakdown across each sub-service. The expanded rows show:
- The friendly sub-service name (e.g.
NAT Data Processing,EBS Snapshots) - The sub-service cost and its share of the parent total
- A relative bar visualization
The Resources page surfaces individual cost rows for each NAT gateway, EBS snapshot, and VPC endpoint with the attached UsageType, so you can drill from a sub-service total all the way down to the specific resource paying for it.
"What's in 'Other'" panel
A dedicated hero panel on the Dashboard summarizes how much of your monthly bill lives inside decomposed sub-services — the slice that would otherwise be invisible behind a single "Other" line. The panel shows:
- The total dollar amount and percentage of bill that was decomposed
- The number of named sub-services CLARITY surfaced
- The top 3 sub-services by cost
TIP
Want to assign cost owners to these sub-services? Use Cost Allocation rules — sub-services participate in chargeback exactly like top-level services.
Inter-AZ data transfer attribution
Inter-AZ traffic (zone-to-zone inside the same region) is one of the most expensive lines on a typical AWS, Azure or GCP bill — and historically the hardest to attribute. Most tools either ignore it or require you to enable VPC Flow Logs (which add $50–500/mo to your cloud bill and become your problem to manage).
CLARITY takes a different approach. A dedicated Inter-AZ data transfer panel on the Dashboard:
- Shows the account-level cost for inter-AZ traffic over the trailing 30 days, decomposed from your billing API into a named sub-service row (
EC2 / Inter-AZ Data Transfer,Network Egress (Inter-AZ),Bandwidth - Inter-Regiondepending on provider). - Reads per-NIC byte counters that CloudWatch / Azure Monitor / Cloud Monitoring already collect for free, and uses them to attribute as much of the inter-AZ pool as we can defensibly tie to specific resources.
- Renders a reconciliation banner that is honest about what's attributed and what isn't:
- None / Low (0% attributed) — banner is amber, points you straight at network observability tools.
- Partial (<50% attributed) — banner shows the dollar amount we tied to specific resources and the residual.
- Good (50–90%) / Verified (≥90%) — banner turns emerald.
- For the unattributed residual, points to your existing monitoring tool for destination-level drill-down — whichever your network team already uses.
The per-NIC byte signal can't cleanly separate inter-AZ from internet or inter-region traffic — that's a real limitation of metric-level data and we don't pretend otherwise. When you need a deterministic source-and-destination flow record, network observability tools are the right answer, and we say so explicitly.
When inter-AZ cost crosses the $300/mo threshold (configurable per-deployment), CLARITY also fires an Inter-AZ excess insight under Insights naming the top byte contenders and suggesting same-AZ co-location, topology-aware load balancing, and caching as the standard remediations.
By category
Group costs into logical categories:
- Compute — Virtual machines, containers, serverless functions
- Storage — Object storage, block storage, file systems
- Database — Managed databases, caches, data warehouses
- Networking — Load balancers, NAT gateways, bandwidth
- Other — Support charges, marketplace, miscellaneous
By region
Understand where your infrastructure runs and what it costs per region. Useful for identifying unexpected spend in regions you do not actively use.
Daily cost trend chart
The interactive line chart displays daily spend over time. Hover over any data point to see the exact cost for that day. The chart automatically adjusts its scale based on your date range selection.
Currency Support
All costs are displayed in your configured currency. CLARITY uses live exchange rates from each cloud provider's billing APIs to ensure accurate multi-currency reporting.
Budget status
Active budgets appear as progress bars at the bottom of the Dashboard. Each bar shows:
- Current spend vs. budget threshold
- Color coding: green (on track), amber (approaching threshold), red (exceeded)
- Percentage consumed
WARNING
Budget alerts are evaluated continuously. If a budget exceeds its configured threshold, notifications are sent to the designated recipients.
Quick wins panel
The Quick Wins panel highlights the top savings opportunities across your cloud accounts, ranked by estimated monthly savings. Click any item to navigate directly to the relevant Insights or Commitments page for more detail.