ROI Report
The ROI Report is the proof artifact you hand to a CFO, finance lead, or board member who asks: "what is CLARITY actually doing for us?". It is not a dashboard of opportunities — it's a verifiable ledger of realized savings against a counterfactual baseline (what you would have paid if you had ignored every CLARITY finding), set against the subscription and savings fees you've actually paid.
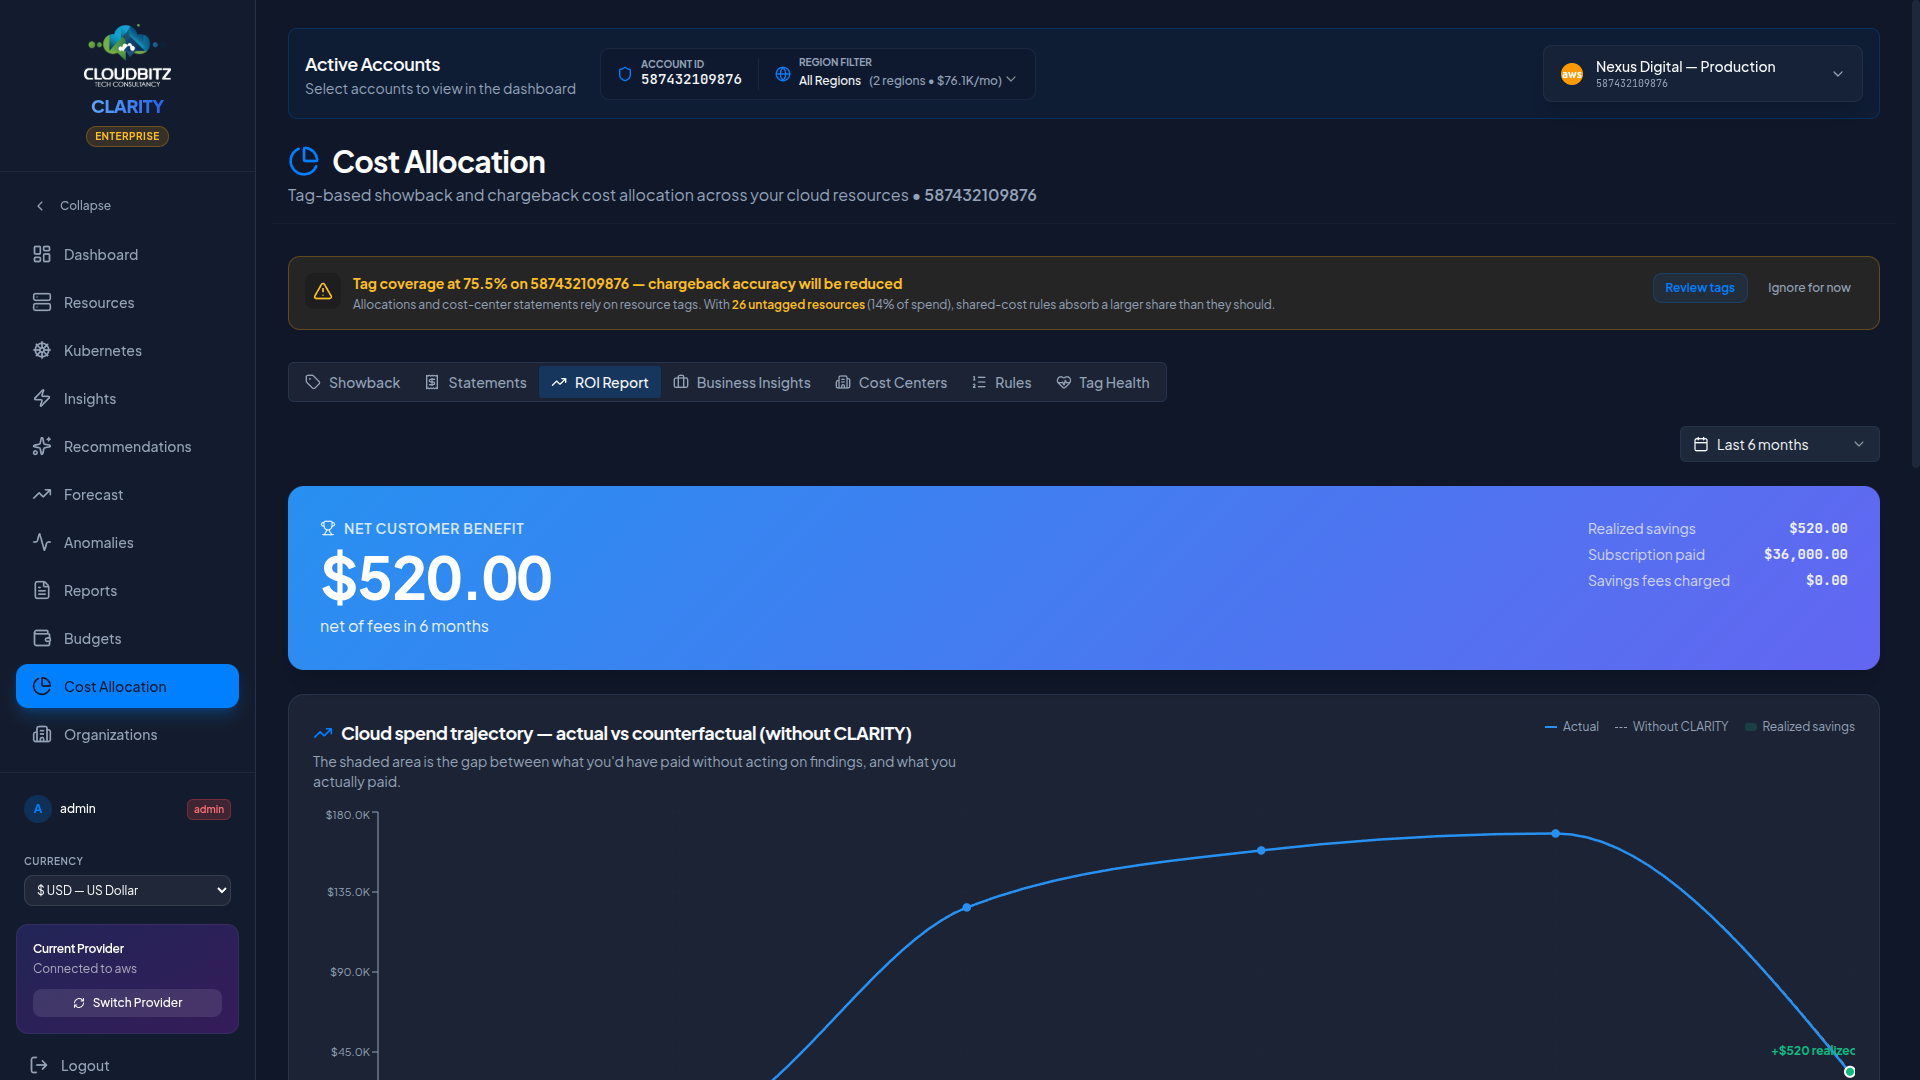
It lives inside Cost Allocation → ROI Report tab. Use it when accounting needs to defend the platform spend, when renewing CLARITY, or when running an internal post-mortem on a finance-led optimization sprint.
What it answers
| Question | Where to look |
|---|---|
| What did acting on CLARITY findings save us, net of fees? | Hero card — Net customer benefit |
| Are our cloud costs actually trending down because of action, or just because of vendor discounts? | Trajectory chart |
| How fast are findings turning into action and into measurable savings? | Lifecycle funnel |
| Which specific resources delivered most of the savings? | Top wins table |
| What's still on the table? | Outstanding opportunity card |
| Is the subscription cost reasonable relative to recovered spend? | Transparency tiles |
The six panels
1. Hero card — net customer benefit
The headline number: cumulative realized savings minus subscription paid minus savings fees charged. Anchored to the time window selected in the top-right (3 / 6 / 12 months, or since signup). Includes the three component totals so the math is fully decomposed and auditable.
2. Trajectory chart — actual vs counterfactual
A composed line + shaded-area chart with two curves:
- Solid blue — actual cloud spend per month from your billing data.
- Dashed gray — the counterfactual: what the same workloads would have cost if every "right-size", "idle resource", "stopped instance with attached volume", and "unattached disk" finding had been left in place. Built by replaying the baseline cost of every closed/implemented action.
The shaded green band between the two lines is the realized savings delta. A callout pinpoints the most recent month so the latest delivery is unmissable even when the band is visually narrow.
3. Lifecycle funnel — findings to actions to realized savings
Three bars per month: identified findings, actions taken, and dollars-of-savings actually realized. Read it as an execution-velocity meter — a healthy account turns identified findings into action within 4–8 weeks and into realized savings the month after.
4. Top wins table
Top 10 resources sorted by total savings delivered to date. Each row shows:
- The resource ARN / name
- The insight type that flagged it (right-size, orphan disk, idle Redshift, etc.)
- Baseline monthly cost before the action
- Realized savings per month
- The date the savings started
- Months of realized savings to date
- Total dollars delivered
This is the ledger detail. Drill into any resource by clicking through to the Resources page.
5. Outstanding opportunity
The annualized dollar value of findings still untouched. This is what would land in the trajectory band over the next 12 months if every open recommendation were acted on today.
6. Subscription + fee transparency
Three tiles — subscription paid, savings fees charged, realized savings — plus a one-line ratio: "For every $1 you've paid CLARITY, you've recovered $X in realized savings." Same numbers as the hero, restated next to the savings.
The counterfactual concept
The trajectory chart's gray dashed line is the question every CFO asks: "how do I know this would have been more expensive without CLARITY?"
The counterfactual is computed per-month per-resource. For every recommendation action that ended in implemented or verified, we hold the resource's baseline monthly cost (captured at the moment of implementation) and re-add it to spend for every month the action remains active. Sum across all such actions and you get the counterfactual line — the spend you would have paid if every finding had been ignored.
This is conservative on purpose:
- It only counts savings from actions you actually took. Pending and dismissed actions never appear in the counterfactual.
- It uses the baseline cost at the moment of action — not a hypothetical "what if you upgraded?" number.
- It excludes savings fees and subscription cost from the trajectory itself (those live in the transparency tiles instead).
How to access it
- Open the tenant app at your Cost Allocation surface.
- Click the ROI Report tab.
- Pick a time window in the top-right (Last 3 months / Last 6 months / Last 12 months / Since signup).
- Hover any month on either chart for tooltips.
Per-account view
If you have more than one cloud account connected, an account scope strip appears above the headline. The default view aggregates ROI across every account in your tenant — that's the number you'd defend in a renewal conversation. Click any account tile to rescope all six panels (hero, trajectory, funnel, top wins, outstanding, transparency) to that single account. Click again, or click All accounts, to return to the tenant-wide rollup.
The pivot is local to the ROI Report tab — switching accounts here does not change the global account selector at the top of the app, and it does not trigger a page reload. Use it to:
- Compare which AWS / Azure / GCP account is delivering the most realized savings
- Build per-business-unit ROI statements when your accounts map 1:1 to teams
- Investigate why one specific account's contribution dropped month over month
PDF & scheduled delivery
The ROI Report is included as a section in two of the auto-generated report templates:
- Executive Summary — key metrics + ROI proof + spend breakdown + AI-validated insights.
- Monthly Review — recurring monitoring report, now anchored on ROI.
In the PDF, the panels render as a hero KPI row, a 6-month numeric trajectory table (numeric instead of charted, for crisp PDF rendering), a top-5 wins ledger, and the transparency tiles. Schedule the Monthly Review template at Reports → Schedule to email it to finance every month.
Tier gating
The ROI Report is available on Pro and above (it depends on the savings ledger that ships with recommendations). Trial accounts see the panel render with a single summary card. Starter accounts see it with a single summary card and a prompt to upgrade.
Why it matters
Most FinOps tools show you findings. CLARITY's ROI Report shows you what those findings delivered — in dollars, on the calendar, against the cost of running the platform. It's the artifact that turns an internal "we should keep CLARITY" into a defensible board-level statement.