Anomaly detection
CLARITY continuously monitors your cloud spend and alerts you when costs deviate from expected patterns. The Anomaly Detection page helps you catch billing surprises before they become expensive problems.
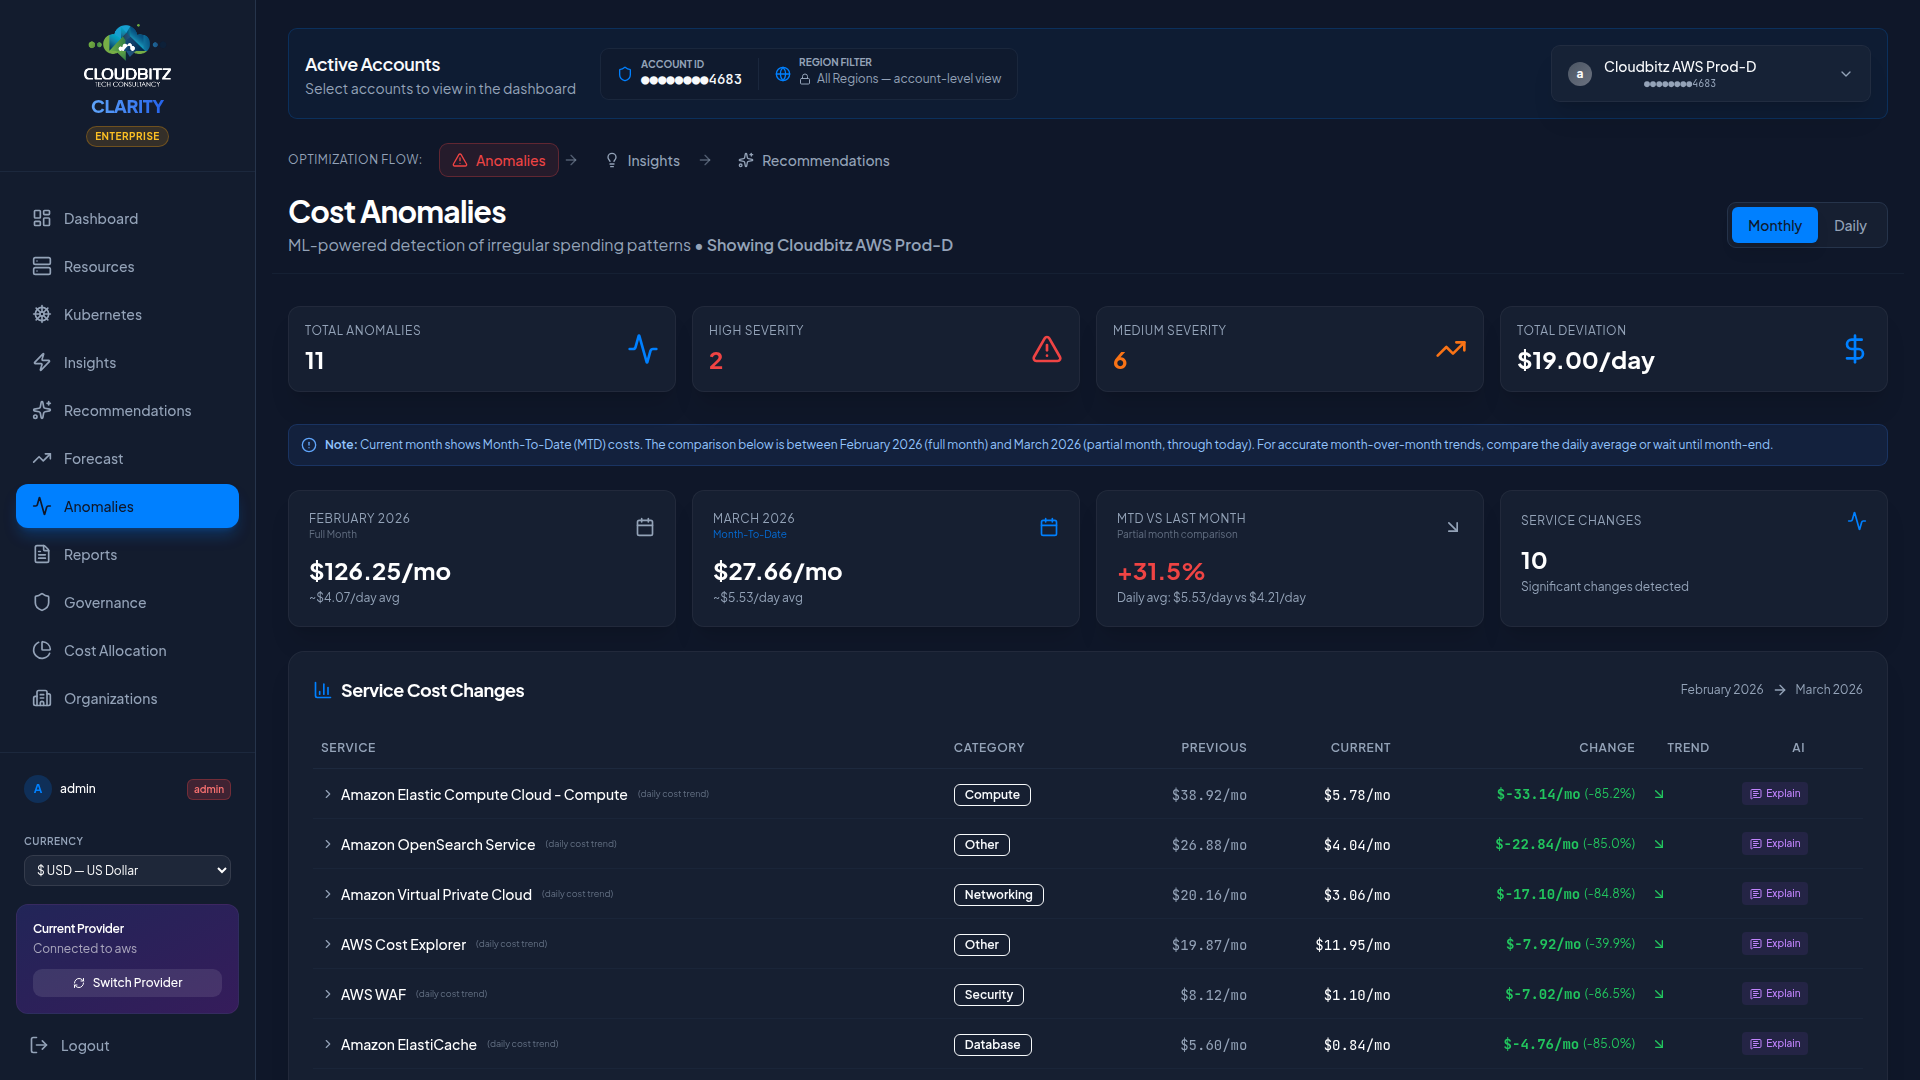
How it works
Anomaly detection uses a 7-day rolling baseline to establish what normal spending looks like for each service and account. When actual costs deviate significantly from this baseline, an anomaly is flagged.
The detection process evaluates:
- Rolling average — Mean daily cost over the past 7 days
- Standard deviation — How much daily costs typically vary
- Current cost — Today's actual spend
- Deviation score — How many standard deviations the current cost is from the mean
INFO
Anomalies are evaluated at the service level (e.g., "EC2 in us-east-1") rather than at the individual resource level. This reduces noise while still catching meaningful cost spikes.
Actual vs. expected cost
Each anomaly displays a clear comparison:
| Field | Description |
|---|---|
| Expected Cost | The predicted daily cost based on the rolling baseline |
| Actual Cost | The real cost recorded for that day |
| Deviation | The dollar and percentage difference |
| Direction | Whether the anomaly is a spike (over) or a drop (under) |
Cost drops can be just as important as spikes — a sudden decrease might indicate a misconfigured service or an unintended resource deletion.
Severity classification
Anomalies are classified by severity based on both the percentage deviation and the absolute dollar impact:
| Severity | Criteria | Action |
|---|---|---|
| Critical | Large deviation with high dollar impact | Investigate immediately |
| High | Significant deviation or moderate dollar impact | Review within 24 hours |
| Medium | Notable deviation with limited dollar impact | Review at next opportunity |
| Low | Minor deviation, small dollar amount | Monitor for recurrence |
WARNING
A 200% spike on a $5/day service is less urgent than a 20% spike on a $500/day service. CLARITY factors in absolute cost impact, not just percentage change.
Contributing resource breakdown
When you click into an anomaly, CLARITY shows which resources contributed most to the cost change. This breakdown helps you pinpoint the root cause:
- Service breakdown — Which sub-services saw cost increases
- Resource list — Specific resources with the largest cost deltas
- Timeline — When the cost change began and whether it is ongoing
Per-resource attribution works for tagged, named resources across:
| Provider | Services |
|---|---|
| AWS | EC2, RDS, EBS volumes / snapshots, S3 buckets, Lambda, EKS pods + deployments, DynamoDB, Redshift, OpenSearch, CloudFront, API Gateway, ELB, EFS, SageMaker (notebooks / endpoints / training jobs), Kinesis, ECR |
| Azure | VMs, Azure SQL, Cosmos DB, Storage Accounts, Functions, AKS pods + deployments, Azure Cache for Redis, Synapse, Managed Disks, Public IPs, VNets |
| GCP | GCE instances, Cloud SQL, Cloud Storage, Cloud Run services, Cloud Functions, GKE pods + deployments, Spanner, Bigtable, BigQuery datasets |
Three honest outcomes for drill-down
Every anomaly drill-down lands in one of three buckets. The UI tells you which:
1. Per-resource attribution available (most common). The list shows specific resources with daily cost, baseline cost, and percentage deviation. Click any resource to drill further.
2. Aggregate-cost service — billed at service level, no per-resource attribution from the billing API alone:
📡 Service-level aggregate cost. Enable VPC/NSG Flow Logs to attribute traffic to specific resources.
This applies to:
- AWS Data Transfer (inter-region, inter-AZ, internet egress)
- Azure Bandwidth (egress)
- NAT data processing (aggregate of all instances behind a NAT)
- Cloud NAT on GCP
- CloudWatch / Custom Metrics and Azure Monitor / Custom Metrics ingestion
Per-resource attribution for these requires VPC Flow Logs (AWS) or NSG Flow Logs (Azure) — the customer enables them at the provider, and a future Project Prism phase ingests them.
3. Service-level only — cost is real but no resources were discoverable:
ℹ️ Cost recorded at service level — no per-resource attribution available. Check IAM permissions or recent resource deletions.
Common causes:
- IAM permissions don't allow the discovery API for that service (rare with the IAM policies CLARITY ships).
- Recent resource deletion: cost rows persist until the billing period closes, but the resource is gone.
- A region we don't sync (e.g., AWS GovCloud or China regions if not enabled).
This bucket is rare in production when the IAM policies are intact. CLARITY surfaces it explicitly rather than showing a fabricated synthetic row, so you always know whether you're looking at real resources or a service-level total.
Sub-service anomalies
Anomaly detection runs at the sub-service level, not just the parent service. When a customer's EC2 / NAT Data Processing line jumps 4× while the parent EC2 total stays in normal range, CLARITY fires an alert specifically on the NAT data — not a vague "EC2 anomaly" that the customer has to drill into.
Each anomaly carries the structured provider SKU alongside the friendly label:
- Friendly label:
EC2 / NAT Data Processing - Structured SKU:
NatGateway-Bytes
Slack and Teams notifications include the SKU on a dedicated line so engineers can immediately:
- Filter the Resources page by that exact sub-service.
- Write a Cost Allocation rule that sends future occurrences to the right cost center.
- Recognise the same line item across providers (
NatGateway-Bytesfor AWS,CloudNat-Bytesfor GCP).
The structured SKU also anchors the alert's deduplication identity. Renaming the friendly label (something CLARITY occasionally does for clarity) does not re-fire historical alerts — the SKU is stable across label refactors.
Setting up anomaly alerts
Configure alerts to be notified when anomalies are detected:
- Navigate to Anomaly Detection and click Configure Alerts
- Set the sensitivity level (Low, Medium, High)
- High sensitivity catches smaller deviations but may produce more alerts
- Low sensitivity only triggers on major cost spikes
- Choose notification channels:
- Email notifications to specified recipients
- In-app notification bell
- Set minimum cost threshold to avoid alerts on trivially small anomalies
TIP
Start with medium sensitivity and adjust based on your experience. If you receive too many false positives, lower the sensitivity or increase the minimum cost threshold.
Investigating anomalies
When an anomaly appears, follow this workflow:
1. assess severity and impact
Check the dollar impact first. A critical anomaly on a core production service deserves immediate attention.
2. review the timeline
Look at when the cost change started. Correlate with recent deployments, configuration changes, or scaling events.
3. drill into resources
Use the contributing resource breakdown to identify which specific resources are responsible.
4. check for known causes
Common causes of cost anomalies include:
- Auto-scaling events responding to traffic spikes
- New resource deployments (expected cost increases)
- Data transfer spikes (large file uploads, cross-region traffic)
- Spot/preemptible instance interruptions causing on-demand fallback
- Front-loaded billing (e.g., Route 53 zone fees charged on day 1)
5. resolve or dismiss
Once investigated, mark the anomaly as:
- Acknowledged — Known cause, no action needed
- Investigating — Still looking into it
- Resolved — Root cause identified and addressed