Kubernetes
CLARITY provides deep visibility into Kubernetes costs across all three major managed services. The Kubernetes page breaks down spending by cluster, namespace, and workload so you can understand exactly where your container costs are going.
Multi-Cluster support
CLARITY discovers and tracks Kubernetes clusters across all connected cloud accounts:
| Service | Provider | Discovery |
|---|---|---|
| EKS | AWS | Automatic via AWS API |
| AKS | Azure | Automatic via Azure Resource Manager |
| GKE | GCP | Automatic via GCP API |
All clusters appear in a unified view regardless of provider, with provider badges to distinguish them at a glance. CLARITY is designed to scale: fleets of 60+ clusters stay navigable through grouping, multi-select filters, and a split-view detail panel.
Fleet-scale navigation
Cards vs table view
CLARITY automatically picks the right view for your fleet size:
- Small fleets (1–20 clusters) — default to a card grid showing cost composition, compute mode, and region per cluster.
- Large fleets (20+ clusters) — auto-switch to a dense table with one row per cluster, sticky column headers, and sortable columns for Environment, Mode, Region, Nodes, Control Plane, Compute, Support, Total /mo, Pods, and State.
You can override the auto-switch at any time with the view toggle buttons in the top-right — your choice sticks for the rest of the session.
Split-view detail panel
Clicking any cluster opens a 720px detail sidebar next to the fleet list (not over it). Both panels stay fully interactive: you can click another cluster in the list and the panel updates in place, scroll the fleet table, or use filter controls without closing the drawer. The detail panel is sticky so it follows you as you scroll through a long list.
The detail panel has three tabs:
- Namespace Costs — per-namespace cost breakdown with proportional allocation
- Workload Explorer — deployments, pods, and services inside the cluster
- Label Costs — cost grouped by any Kubernetes label key (team, owner, env, etc.)
Your last-used tab is remembered across clusters, so arrow-key scrubbing through your fleet always lands on the same view.
Grouping & filtering
The toolbar gives you four ways to narrow and organize your fleet:
- Group by — None, Environment, Team, Provider, Region, Compute mode, or Account. Group headers show cluster count and total monthly cost per group, and can be collapsed to focus on specific subsets.
- Multi-select filters — stack Provider + Mode + Environment pills to narrow the list (click to toggle, click
Allto reset). - Quick filters:
- 💰 Top 10 $ — immediately shows the 10 most expensive clusters
- 🏷️ Untagged — surfaces clusters missing the Environment tag (governance check)
- ⚠️ With findings — shows only clusters that have open optimization insights
- Search — free-text substring search across cluster name and region
Keyboard shortcuts
| Shortcut | Action |
|---|---|
/ | Focus the search box |
↑ / ↓ | Navigate through clusters |
Esc | Close the detail panel |
Ctrl+B / Cmd+B | Toggle the main sidebar |
Shortcuts are suppressed while you're typing in any input, so they never interfere with typing a cluster name or email address.
Compute mode awareness
CLARITY automatically detects and displays the compute mode of every cluster so you can see what you're actually paying for:
| Mode | Providers | What it means |
|---|---|---|
| Managed Nodes | EKS, AKS, GKE Standard | Traditional node pools of EC2 / VM instances you see and size |
| Fargate | EKS | Serverless per-pod compute — no nodes to manage |
| Autopilot | GKE | Per-pod billing with Google managing the underlying nodes |
| Virtual Nodes | AKS | Azure Container Instances (ACI) as a burst backend |
| Mixed | EKS, AKS | Cluster with multiple compute modes at once (e.g. managed nodes + Fargate profiles) |
Each cluster card and table row is provider/mode-aware — the "Compute" column label changes from "Worker Nodes" to "Fargate Tasks" / "Pod Hours" / "VMs + ACI" so you see the right unit for the right cluster.
Cluster-Level cost tracking
Every cluster is broken down into three cost components so you always know where the money is going:
| Component | What it is |
|---|---|
| Control Plane | Fixed per-cluster fee (EKS $2.40/day, AKS Standard $2.40/day, GKE 1st zonal = free, additional zonal = $2.40/day, GKE Autopilot $2.40/day). CLARITY marks free-tier clusters with a badge that explains why. |
| Worker Compute | Variable cost of nodes, Fargate tasks, Autopilot pod-hours, or Virtual Node ACI containers — whichever applies to the cluster's compute mode. |
| Support Allocation | Load balancers, persistent volumes, data egress, and other cluster-adjacent costs that don't belong to a single namespace. |
The total is displayed as both daily and monthly — in the card view you see all three components stacked with percentage bars, and in the table view they appear as three right-aligned columns plus a bold monthly total.
INFO
Free-tier clusters (AKS Free, GKE 1st zonal) show FREE with a small label explaining the reason so you don't have to remember the provider-specific pricing rules.
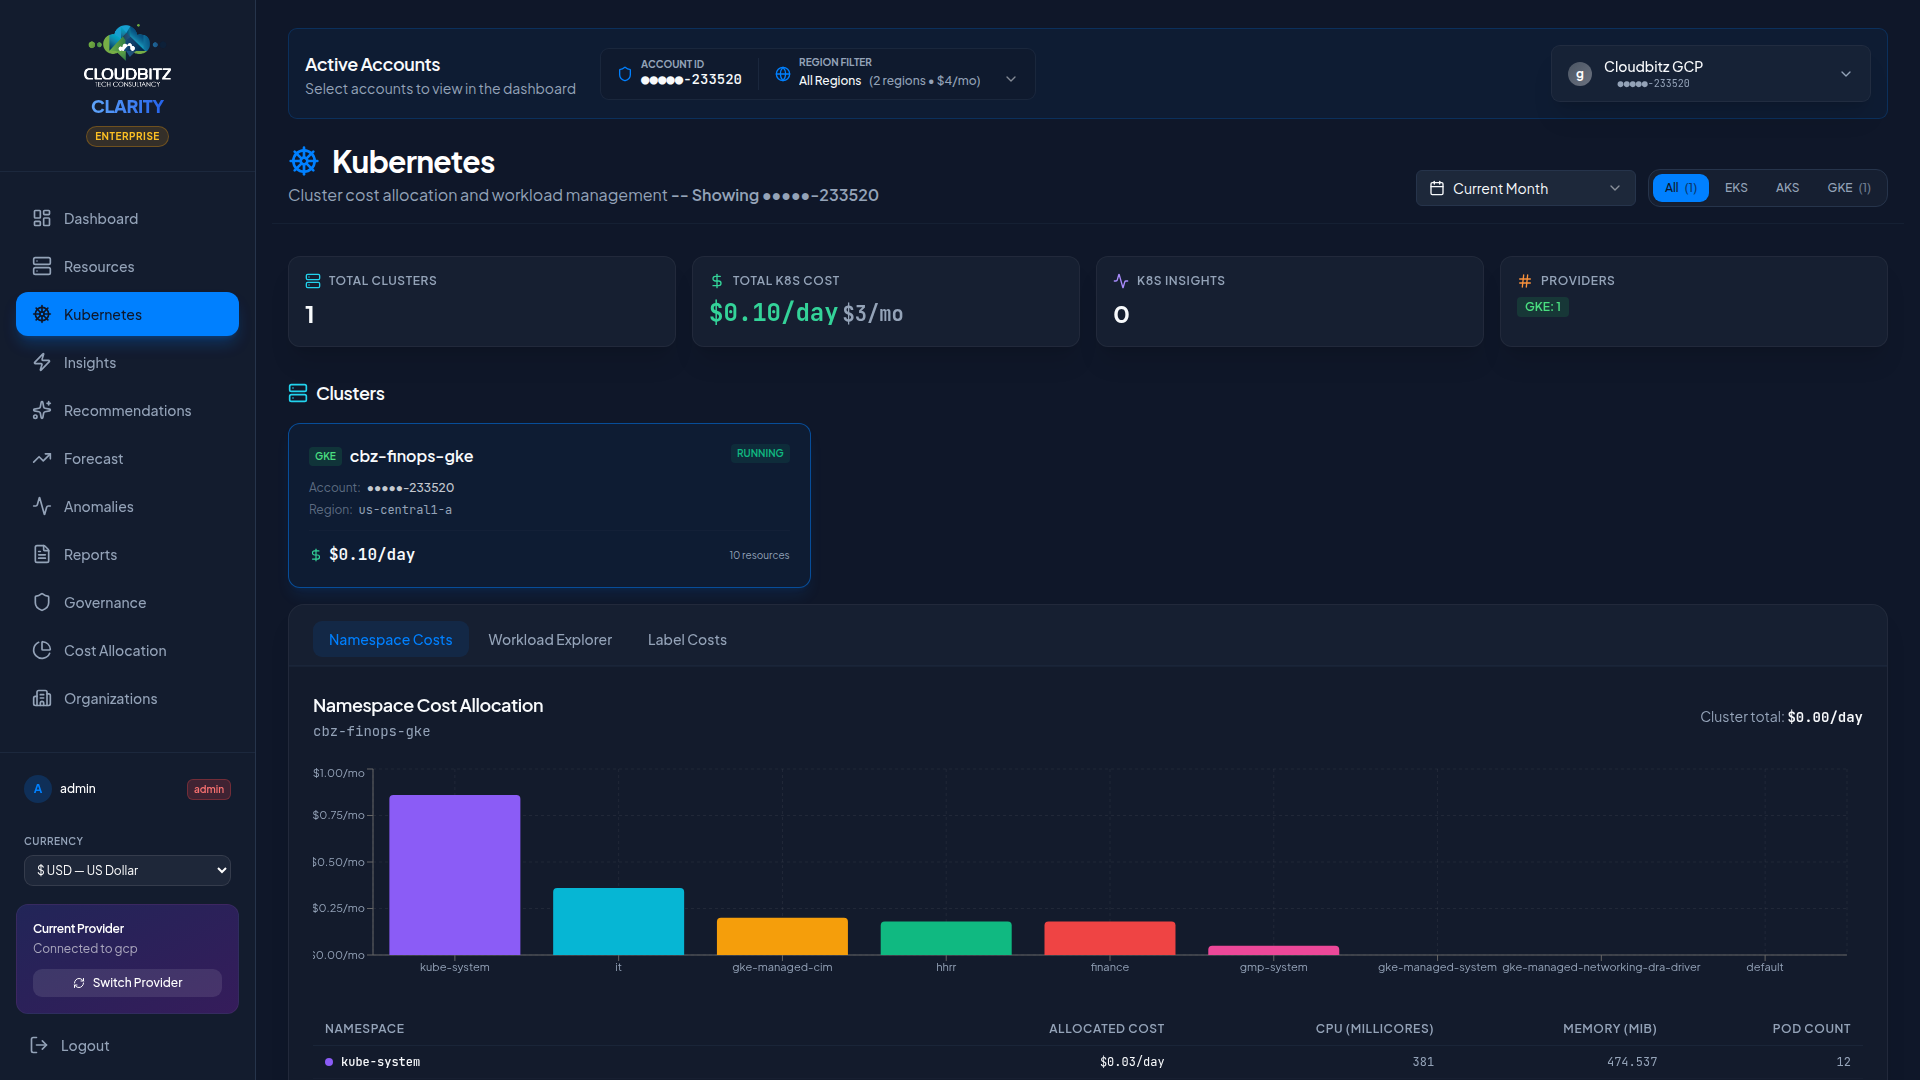
Namespace cost allocation
Kubernetes namespaces are the primary unit of cost allocation within a cluster. CLARITY allocates cluster costs to namespaces based on their proportional share of CPU and memory requests.
How it works
- Total cluster infrastructure cost is calculated from node costs
- Each namespace's resource requests (CPU + memory) are summed
- Costs are split proportionally: a namespace requesting 40% of the cluster's total CPU and memory receives 40% of the cost
| Metric | Weight |
|---|---|
| CPU requests | 50% |
| Memory requests | 50% |
This approach ensures that namespaces consuming more cluster capacity bear a proportionally larger share of the cost.
TIP
Encourage teams to set accurate resource requests on their workloads. Overprovisioned requests inflate the namespace's cost allocation, while missing requests may undercount actual usage.
Compute mode awareness
EKS, AKS, and GKE each ship multiple compute modes. The cluster cards adapt their column labels and cost breakdown so the page tells the truth for each mode:
| Mode | Provider(s) | Pricing | Card column label |
|---|---|---|---|
| Managed nodes | EKS / AKS / GKE | Per-instance hours | "Worker Nodes" |
| Fargate | EKS only | Per-vCPU + per-GB-second | "Fargate Tasks" |
| Autopilot | GKE only | Per-pod-hour | "Pod Hours" |
| Virtual nodes | AKS only (rare) | Per-vCPU + per-GB ACI charges | "VMs + ACI" |
| Mixed | Any | Combination | "Mixed" |
The mode is detected automatically from cluster metadata (Fargate-only clusters have fargateOnly=true, GKE Autopilot has isAutopilot=true). Control-plane charges are surfaced separately ($73/mo EKS, free for AKS Standard tier or first GKE zonal cluster, $73/mo GKE Autopilot).
Workload discovery
CLARITY discovers the full workload hierarchy inside each cluster — provider-neutral, the same depth on EKS, AKS, and GKE:
Cluster (eks-cluster / aks-cluster / gke-cluster)
  └─ Namespace (k8s-namespace)
      └─ Deployment / DaemonSet / StatefulSet (k8s-deployment / k8s-daemonset / k8s-statefulset)
└─ Pod (k8s-pod)| Workload Type | What's Tracked |
|---|---|
| Namespace | Cost allocation, environment / team tags, total pod count |
| Deployment / DaemonSet / StatefulSet | Replica count, CPU/memory requests, average utilisation |
| Pod | Status, restart count, node placement, CPU/memory requests, namespace |
| Services | Type (ClusterIP, LoadBalancer, NodePort), endpoints |
The cluster type carries the provider distinction (eks-cluster, aks-cluster, gke-cluster); workload types beneath are canonical K8s names so the same insight rules and the same UI work uniformly across the three platforms.
K8s-Specific insights
The Insights engine includes rules tailored to Kubernetes environments. Each finding comes with an estimated monthly savings figure, an evidence trail (node count, daily cost, env tag, compute mode), and a concrete next-step recommendation.
Idle clusters
Non-production clusters (sandbox, dev, canary, qa environments) running at full spec 24/7 with minimal workload activity. These are typically forgotten POCs, abandoned migration targets, or demo environments nobody has shut down. CLARITY flags them with severity scaled to monthly cost.
Untagged clusters — governance finding
Clusters with no Owner or Environment tag. Nobody claims responsibility, Finance can't allocate the cost, and the cluster keeps billing. CLARITY surfaces these as a governance finding with the current monthly cost so you can assign an owner or file a termination ticket. Clusters with missing tags also display an inline UNTAGGED pill in the fleet table.
Overprovisioned nodes
Large managed-node clusters (typically >18 nodes) where the aggregate workload requests use a small fraction of available capacity. CLARITY estimates the reclaimable capacity as a percentage of the current compute spend. Consider:
- Reducing the node pool desired count
- Switching to smaller instance types
- Enabling cluster autoscaler with tighter
min/maxboundaries
Cluster autoscaler disabled
Large production clusters running at fixed size with no autoscaling enabled. Off-peak capacity could be released to save ~18% of compute spend on average. Recommendation includes a suggested min / max node range based on the current count.
Spot/Preemptible opportunities
Non-production clusters running entirely on on-demand nodes. Spot (AWS), Spot (Azure), or Preemptible (GCP) instances can cut compute cost by 60–80% for interruption-tolerant workloads. CLARITY targets this specifically at non-production environments because spot interruption is acceptable there; it does not recommend spot for production prod-tagged clusters without additional context.
Namespace cost outliers
Namespaces whose cost allocation has spiked relative to their historical baseline.
WARNING
Kubernetes insights are validated by the same AI engine as other recommendations. Look for the AI validation badge (Agree / Disagree / Partial) to assess confidence before acting.
Tag governance at fleet scale
Managing tags across dozens of clusters is often where FinOps programs fall apart. CLARITY helps close that gap:
- Untagged column flag — every untagged cluster in the fleet table shows an inline
UNTAGGEDpill next to its name so you can spot them while scrolling - Untagged quick filter — one click on the 🏷️ chip narrows the fleet to just the missing-tag clusters
- Governance insights — each untagged cluster over a minimum daily cost threshold generates a finding you can assign to an owner
- Group by Team or Environment — untagged clusters collect in an
(untagged)group header so you see the total unowned spend in one number
Node group and pool details
Expand any cluster to see its node groups (AWS), node pools (GCP/Azure), or managed node groups:
- Instance type and pricing tier (on-demand vs. Spot)
- Node count — Current, minimum, and maximum (if autoscaling is enabled)
- Capacity — Total allocatable CPU and memory
- Utilization — Percentage of capacity consumed by scheduled pods
Cost optimization strategies
Common approaches to reduce Kubernetes costs:
| Strategy | Potential Savings | Effort |
|---|---|---|
| Right-size node instances | 15-30% | Medium |
| Enable cluster autoscaler | 10-25% | Low |
| Use Spot/Preemptible nodes | 40-70% on eligible workloads | Medium |
| Consolidate dev/staging clusters | 20-50% | High |
| Set resource requests accurately | 10-20% | Low |
| Schedule non-prod downtime | 30-60% on dev clusters | Medium |