Dashboard
The Dashboard is your central command center for cloud cost visibility. It provides a real-time overview of your multi-cloud spend across AWS, Azure, and GCP in a single pane of glass.
At a Glance
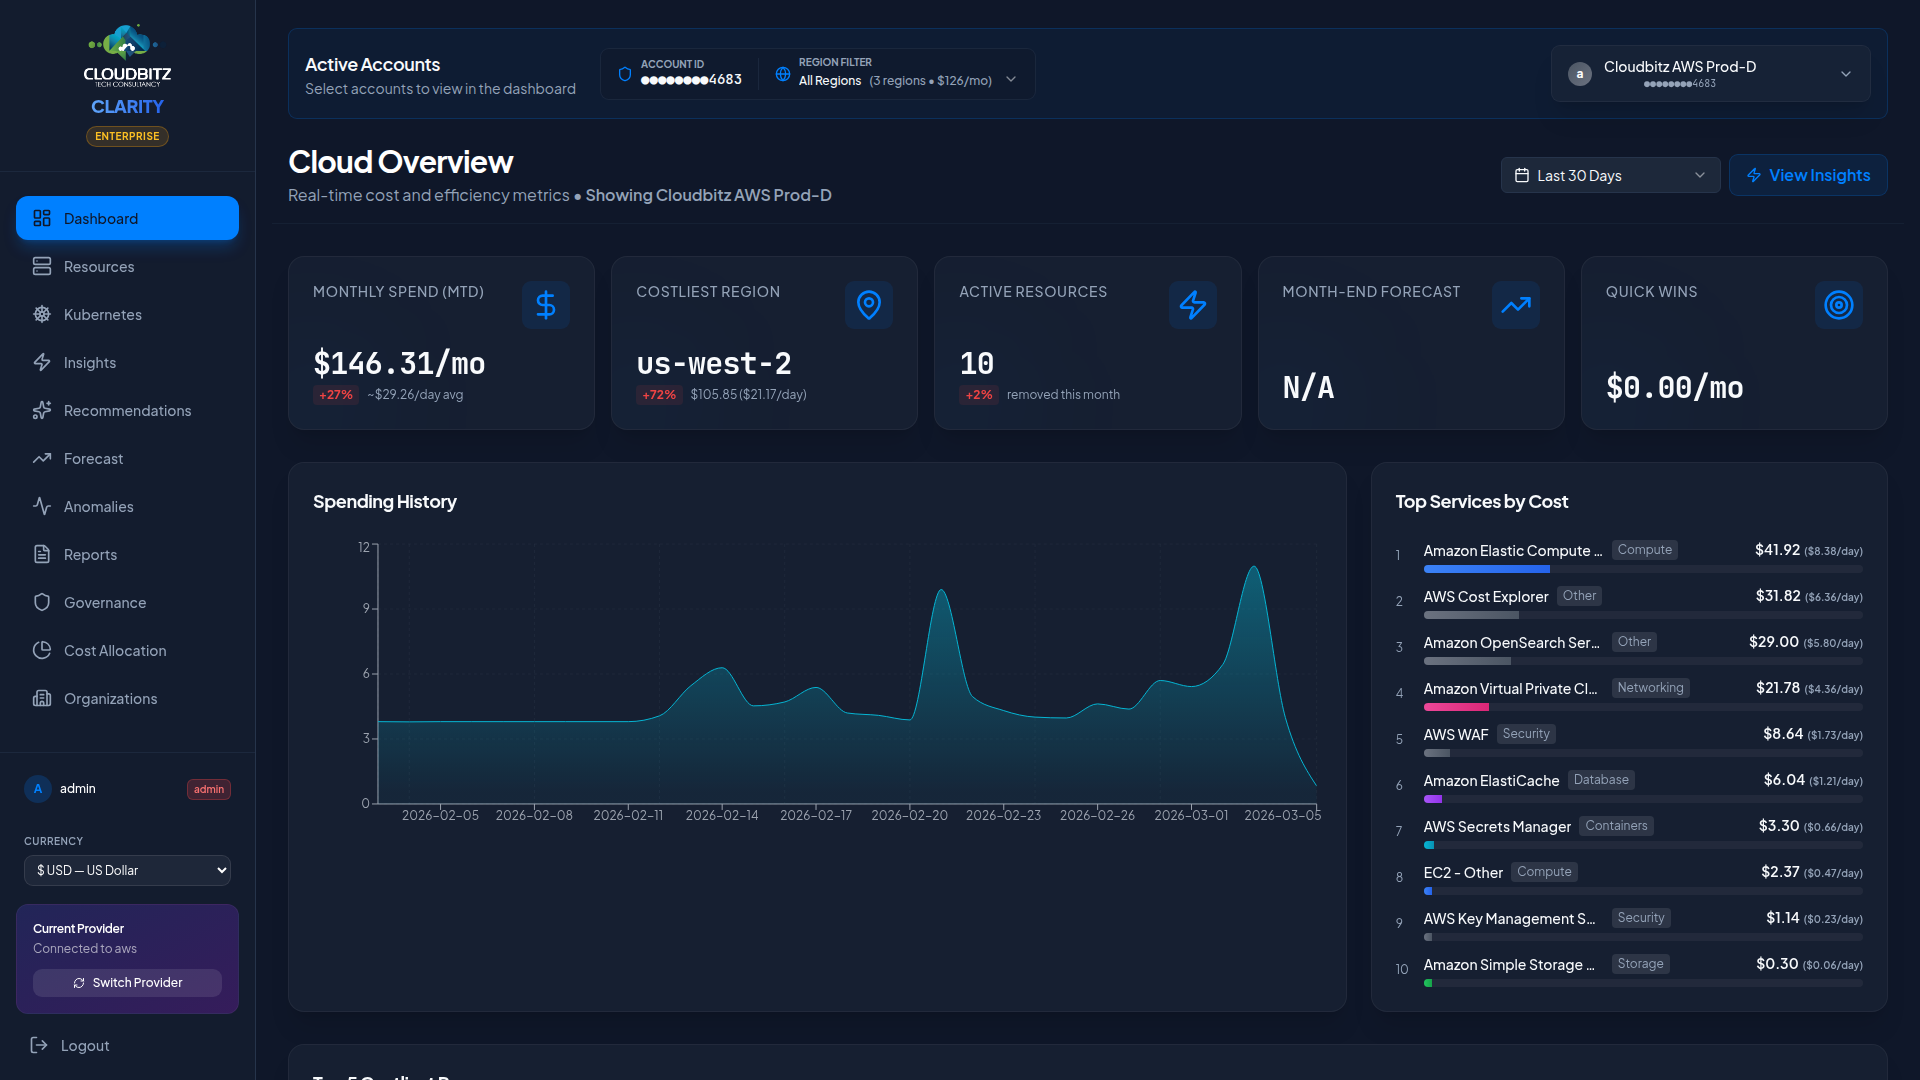
When you first log in, the Dashboard surfaces the metrics that matter most:
| Metric | Description |
|---|---|
| Total Spend (MTD) | Month-to-date spend across all connected cloud accounts |
| Month-over-Month Change | Percentage change compared to the previous month |
| Daily Cost Trend | Interactive chart showing daily spend over the selected period |
| Provider Breakdown | Pie chart splitting costs by cloud provider |
| Top Services | Ranked list of your highest-cost services |
| Quick Wins | Actionable savings opportunities you can act on today |
| Budget Status | Progress bars for active budgets with threshold alerts |
Date Range Selector
Use the date range selector in the top-right corner to control the time window for all dashboard widgets.
| Option | Description |
|---|---|
| Last 7 Days | Recent week of spend data |
| Last 30 Days | Rolling month view |
| Last 90 Days | Quarter-level trend analysis |
| Custom Range | Pick any start and end date |
Smart Default
Early in the month (days 1-6), CLARITY automatically defaults to Last 30 Days instead of the current month. This prevents misleading comparisons when only a few days of data are available.
Provider Filter
If you have multiple cloud providers connected, use the provider filter to focus on a single provider or view all providers combined.
- All Providers — Aggregated view across AWS, Azure, and GCP
- Single Provider — Filter to see only one provider's costs, services, and trends
The selected provider persists across all pages during your session, so switching on the Dashboard applies everywhere.
Cost Breakdown Views
The Dashboard offers three ways to slice your cloud spend:
By Service
See which cloud services (EC2, Azure VMs, Cloud Storage, etc.) are driving the most cost. The top services panel ranks them by total spend and shows the trend direction.
By Category
Group costs into logical categories:
- Compute — Virtual machines, containers, serverless functions
- Storage — Object storage, block storage, file systems
- Database — Managed databases, caches, data warehouses
- Networking — Load balancers, NAT gateways, bandwidth
- Other — Support charges, marketplace, miscellaneous
By Region
Understand where your infrastructure runs and what it costs per region. Useful for identifying unexpected spend in regions you do not actively use.
Daily Cost Trend Chart
The interactive line chart displays daily spend over time. Hover over any data point to see the exact cost for that day. The chart automatically adjusts its scale based on your date range selection.
Currency Support
All costs are displayed in your configured currency. CLARITY uses live exchange rates from each cloud provider's billing APIs to ensure accurate multi-currency reporting.
Budget Status
Active budgets appear as progress bars at the bottom of the Dashboard. Each bar shows:
- Current spend vs. budget threshold
- Color coding: green (on track), amber (approaching threshold), red (exceeded)
- Percentage consumed
WARNING
Budget alerts are evaluated continuously. If a budget exceeds its configured threshold, notifications are sent to the designated recipients.
Quick Wins Panel
The Quick Wins panel highlights the top savings opportunities across your cloud accounts, ranked by estimated monthly savings. Click any item to navigate directly to the relevant Insights or Commitments page for more detail.