Kubernetes
CLARITY provides deep visibility into Kubernetes costs across all three major managed services. The Kubernetes page breaks down spending by cluster, namespace, and workload so you can understand exactly where your container costs are going.
Multi-Cluster Support
CLARITY discovers and tracks Kubernetes clusters across all connected cloud accounts:
| Service | Provider | Discovery |
|---|---|---|
| EKS | AWS | Automatic via AWS API |
| AKS | Azure | Automatic via Azure Resource Manager |
| GKE | GCP | Automatic via GCP API |
All clusters appear in a unified view regardless of provider, with provider badges to distinguish them at a glance.
Cluster-Level Cost Tracking
Each cluster card displays:
- Total cluster cost — Infrastructure cost of all nodes in the cluster
- Node count — Number of worker nodes (and node pools/groups)
- Instance types — What machine types the nodes are running
- Provider badge — EKS, AKS, or GKE identifier
- Region — Where the cluster is deployed
INFO
Cluster costs include the node compute costs, attached storage, and networking. Control plane costs (which vary by provider) are tracked separately where the provider reports them.
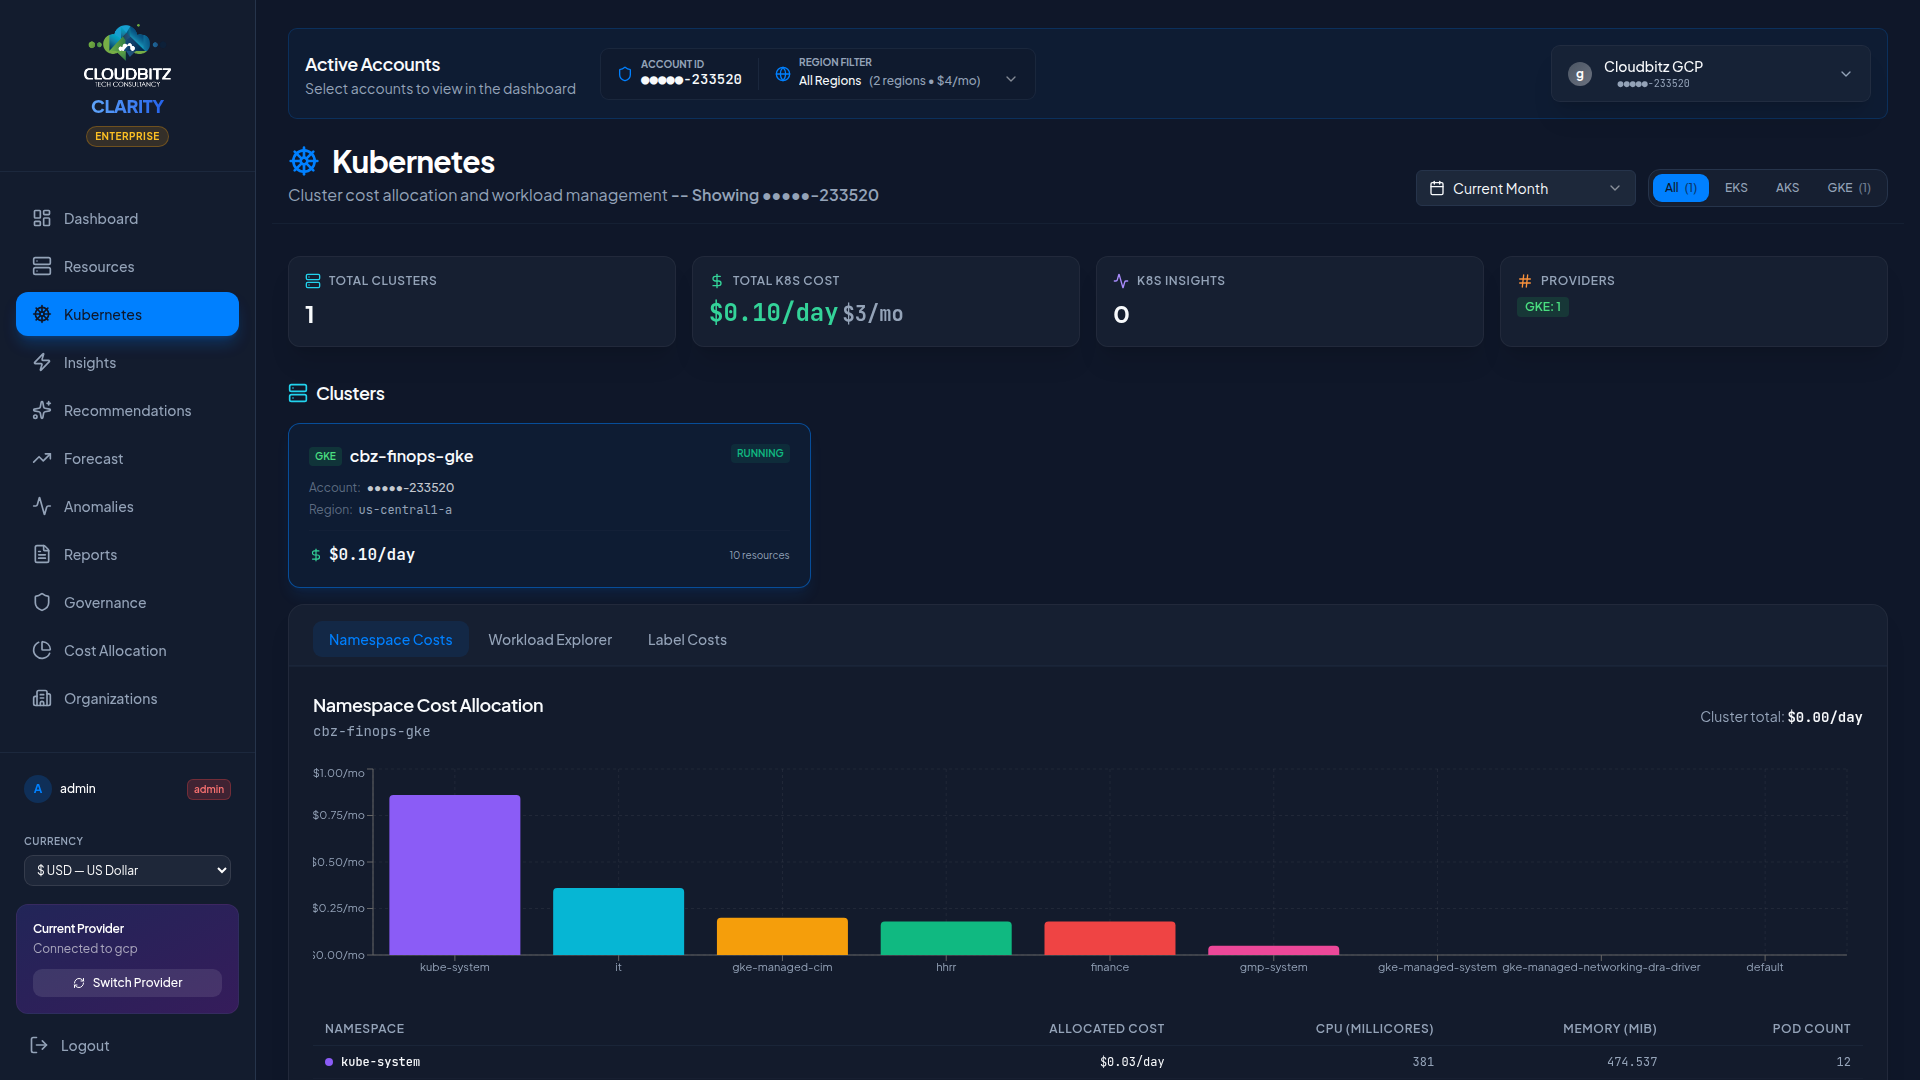
Namespace Cost Allocation
Kubernetes namespaces are the primary unit of cost allocation within a cluster. CLARITY allocates cluster costs to namespaces based on their proportional share of CPU and memory requests.
How It Works
- Total cluster infrastructure cost is calculated from node costs
- Each namespace's resource requests (CPU + memory) are summed
- Costs are split proportionally: a namespace requesting 40% of the cluster's total CPU and memory receives 40% of the cost
| Metric | Weight |
|---|---|
| CPU requests | 50% |
| Memory requests | 50% |
This approach ensures that namespaces consuming more cluster capacity bear a proportionally larger share of the cost.
TIP
Encourage teams to set accurate resource requests on their workloads. Overprovisioned requests inflate the namespace's cost allocation, while missing requests may undercount actual usage.
Workload Discovery
CLARITY discovers workloads running inside each cluster:
| Workload Type | What's Tracked |
|---|---|
| Deployments | Replica count, CPU/memory requests, namespace |
| Pods | Status, node placement, resource consumption |
| Services | Type (ClusterIP, LoadBalancer, NodePort), endpoints |
Workloads are displayed as child resources under their parent cluster in the resource hierarchy.
K8s-Specific Insights
The Insights engine includes rules tailored to Kubernetes environments:
Idle Clusters
Clusters with very low CPU utilization across all nodes. These may be development or staging environments that could be scaled down or shut off outside business hours.
Overprovisioned Nodes
Node groups where the aggregate workload requests use a small fraction of available capacity. Consider:
- Reducing the node count
- Switching to smaller instance types
- Enabling cluster autoscaler with tighter boundaries
Spot/Preemptible Opportunities
Workloads running on on-demand nodes that could tolerate Spot (AWS), Spot (Azure), or Preemptible (GCP) instances. Stateless workloads, batch jobs, and CI/CD runners are common candidates.
Namespace Cost Outliers
Namespaces whose cost allocation has spiked relative to their historical baseline.
WARNING
Kubernetes insights are validated by the same AI engine as other recommendations. Look for the AI validation badge (Agree/Disagree/Partial) to assess confidence.
Node Group and Pool Details
Expand any cluster to see its node groups (AWS), node pools (GCP/Azure), or managed node groups:
- Instance type and pricing tier (on-demand vs. Spot)
- Node count — Current, minimum, and maximum (if autoscaling is enabled)
- Capacity — Total allocatable CPU and memory
- Utilization — Percentage of capacity consumed by scheduled pods
Cost Optimization Strategies
Common approaches to reduce Kubernetes costs:
| Strategy | Potential Savings | Effort |
|---|---|---|
| Right-size node instances | 15-30% | Medium |
| Enable cluster autoscaler | 10-25% | Low |
| Use Spot/Preemptible nodes | 40-70% on eligible workloads | Medium |
| Consolidate dev/staging clusters | 20-50% | High |
| Set resource requests accurately | 10-20% | Low |
| Schedule non-prod downtime | 30-60% on dev clusters | Medium |